library(ggplot2)
# ggplot2 bundles the `mpg` dataset (MIT license, same as ggplot2 itself)
data(mpg, package = "ggplot2")12 Your First Visualization
Learning Objectives: After this chapter you will be able to:
- Load
ggplot2and its bundledmpgdataset.- Draw the same scatterplot in base R and in ggplot2.
- Describe a plot as data + aesthetics + geometry.
Common Mistake: Base R has no
mpgdataset (it hasmtcars).plot(mpg$displ, mpg$hwy)withoutlibrary(ggplot2)fails withobject 'mpg' not found. Always loadggplot2first.
12.1 Base R graphics
plot(mpg$displ, mpg$hwy, xlab = "Displacement", ylab = "Highway MPG")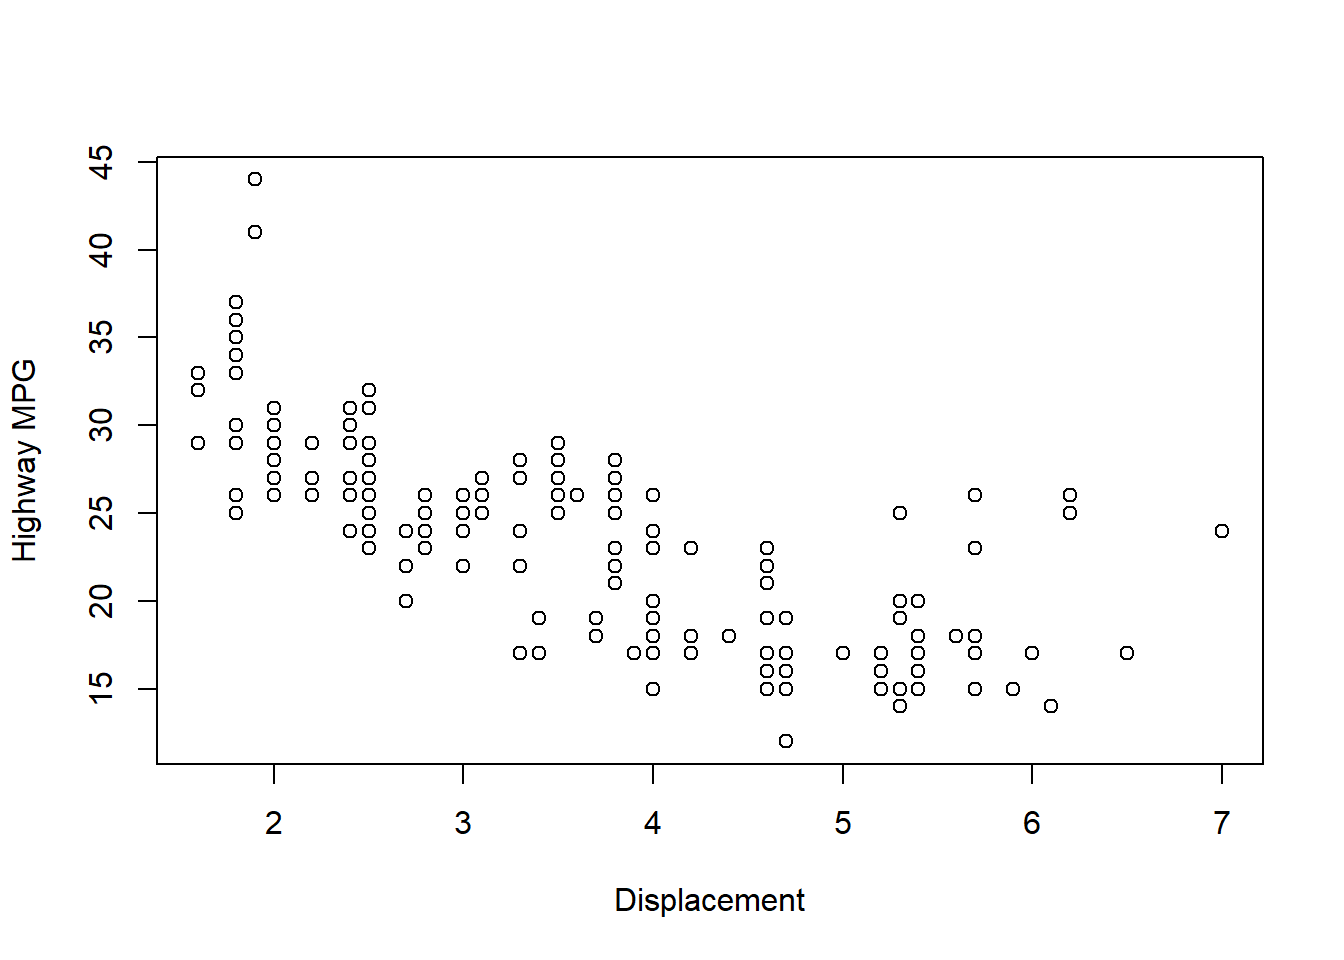
12.2 ggplot2 graphics
ggplot(mpg, aes(x = displ, y = hwy)) +
  geom_point() +
  labs(x = "Displacement", y = "Highway MPG")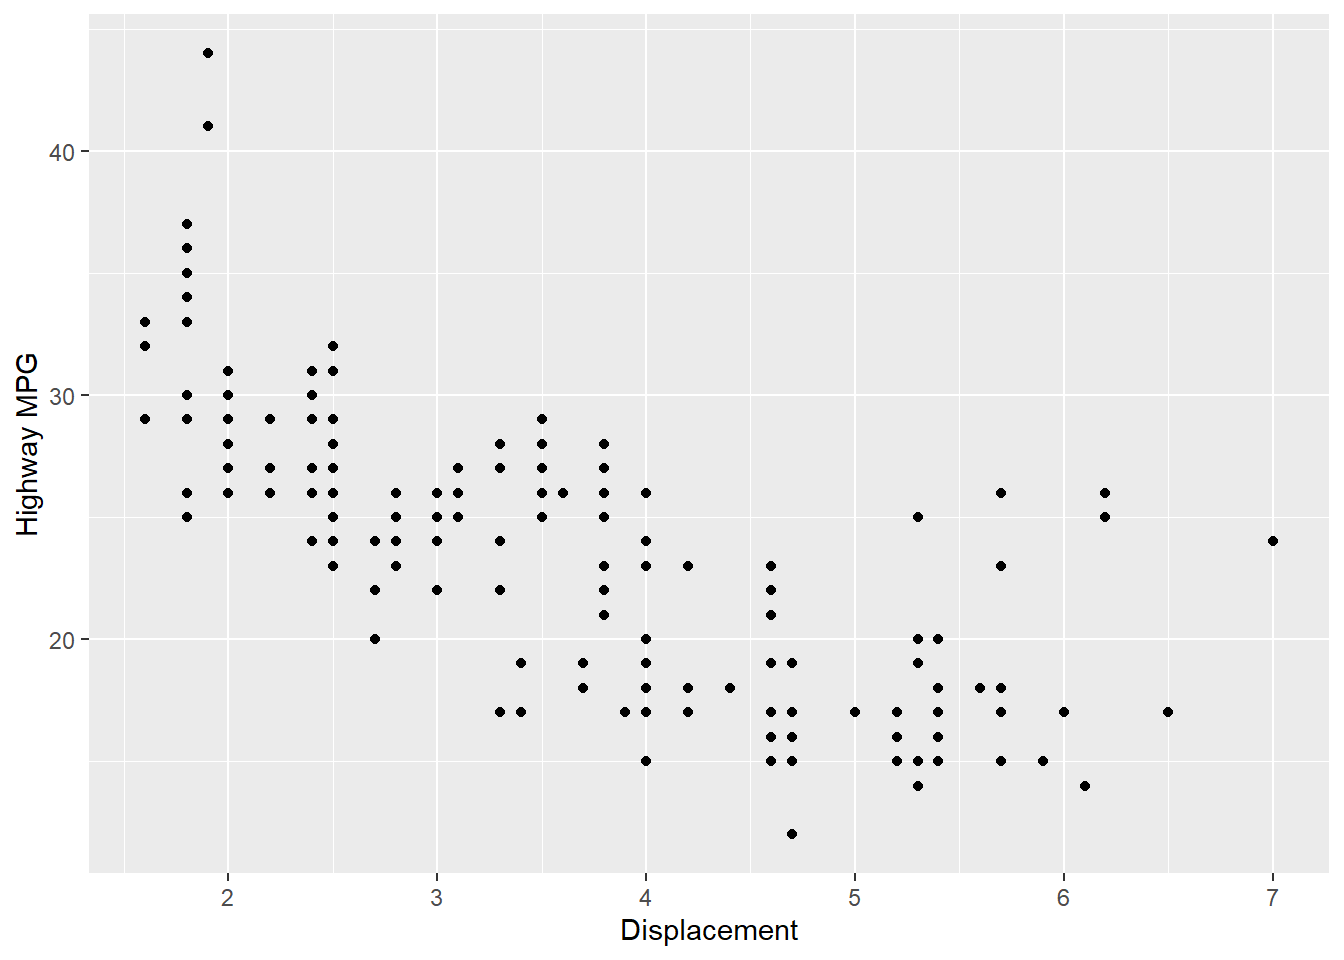
Mental model: every ggplot is data (mpg) + aesthetics (aes(x, y)) + geometry (geom_point()). Change the geometry, keep the mapping.
Try it in your browser
Edit the code below and press Run. It executes entirely in your browser via WebR — no R installation needed. The runtime downloads once, on this page only.
12.3 Practice Check
Knowledge Check: Data + aesthetics + geometry In ggplot(mpg, aes(x = displ, y = hwy)) + geom_point(), which part is the data, which is the aesthetics mapping, and which is the geometry?
Click to reveal answer
Answer: Data: mpg. Aesthetics: aes(x = displ, y = hwy). Geometry: geom_point().
ggplot() takes the data and the variable mapping; each geom_*() layer decides how those mapped variables are drawn.
Knowledge Check: Why library(ggplot2) comes first What error do you get from plot(mpg$displ, mpg$hwy) in a fresh R session, and why?
Click to reveal answer
Answer: object 'mpg' not found — base R has no mpg dataset (it has mtcars); mpg only exists after library(ggplot2) (or data(mpg, package = "ggplot2")).
Knowledge Check: Changing the geometry How would you turn the scatterplot into a smoothed trend line plot without changing the data or the variable mapping?
Click to reveal answer
Answer: Replace geom_point() with geom_smooth() (or add it as a second layer).
Knowledge Check: Aesthetics mapping In aes(x = displ, y = hwy), what do x and y refer to — plot labels or dataset columns?
Click to reveal answer
Answer: Dataset columns: mpg$displ mapped to horizontal position, mpg$hwy to vertical position.
aes() maps columns of the data to visual properties. Labels are set separately with labs().
Knowledge Check: Base R vs ggplot2 The base R call repeats mpg$ twice; the ggplot2 call mentions mpg once. Why is that difference useful as plots get more complex?
Click to reveal answer
Answer: Declaring the data once in ggplot(mpg, ...) means every layer inherits it — you never retype the data source per variable, so longer plots stay readable and less error-prone.
data$column for every variable, especially with facets and multiple geoms.